Image scale and sampling · EU
Does your image scale justify changing the camera?
Separate pixel scale, measured star width and atmospheric seeing before deciding whether a camera or focal-length change deserves consideration.
Use image scale to describe how your camera samples the sky, then examine actual star measurements before considering an equipment change. A calculator result alone cannot establish your atmospheric seeing or explain why an image looks soft.
The useful decision is whether you have enough evidence to investigate a different sampling arrangement. That requires keeping three quantities separate: the angular sky coverage of a pixel, the width of stars in your recorded images, and the atmospheric conditions through which you observed.
Put the quantities in separate columns
Pixel scale expresses angular coverage in arcseconds per pixel. For square pixels, the usual calculation is 206.265 multiplied by pixel size in micrometres, divided by effective focal length in millimetres. The Astronomy Tools sampling calculator publishes this formula and explicitly advises against making a purchase decision from pixel scale alone.
Star width is a measurement from an image. FWHM, or full width at half maximum, describes the width of a fitted star profile at half its peak above the background. Siril can report widths along two axes in pixels, or in arcseconds when sampling is known. Its image-analysis tutorial also explains roundness, which helps distinguish a compact star from an elongated one.
Seeing describes atmospheric turbulence. ESO distinguishes it from image quality, the measured FWHM of a long-exposure stellar image at the telescope’s focal plane. The latter belongs to an observation at a particular wavelength and airmass. These are related quantities, but they are not interchangeable. ESO’s observing-condition definitions make that distinction explicit.
Give your observing record separate columns for all three. If seeing is unknown, write “unknown”; do not fill the gap with your camera’s pixel scale.
Calculate a scale you can trace
Start with the pixel size and effective focal length for the configuration that produced the file. Record whether a reducer, amplifier or binning setting was involved. Keep the original inputs beside the result so that you can revisit them rather than trusting an unexplained number saved months ago.
Use the pixel scale and sampling calculator for the calculation. If you are also reconsidering composition, consult choosing focal length and field of view: a sampling decision still has to serve the target you want to photograph.
Write the result with its units every time. “1.55 arcseconds per pixel” is a sampling statement. “1.55 arcseconds seeing” would be a different claim requiring different evidence.
A hypothetical comparison that avoids a false upgrade
Suppose an invented setup uses 3.76-micrometre pixels at an effective focal length of 500 mm. Its calculated scale is:
206.265 × 3.76 ÷ 500 = approximately 1.55 arcseconds per pixel.
Now suppose a measured star width is 2.4 pixels. Multiplying by the unrounded scale gives approximately 3.72 arcseconds FWHM. This describes that recorded star measurement; it does not establish 3.72-arcsecond atmospheric seeing.
Imagine a second arrangement with the same pixel size at 1,000 mm. Its scale is approximately 0.776 arcseconds per pixel. If, purely for this example, its measured angular star width were also 3.72 arcseconds, that width would occupy approximately 4.8 pixels.
The second image would therefore have wider stars in pixel units without wider stars in angular units. Comparing 2.4 pixels with 4.8 pixels alone would give the wrong impression. Equally, the smaller pixel scale would not demonstrate that extra celestial detail had been recorded. The hypothetical angular width was held constant deliberately; a real equipment change needs real measurements.
Build a small, comparable evidence set
Choose a modest set of original exposures and keep their capture details together. For a first comparison, use the same setup, filter, exposure length and analysis method. Note focus changes and any obvious interruptions. This is an editorial method for making the comparison interpretable, rather than a prescribed seeing measurement.
In Siril, inspect the stars selected for analysis. The project’s tutorial warns that automatic detection can include bright objects that are not suitable stars. Use consistent selection criteria and record both width and shape rather than copying a single headline statistic. Siril’s Dynamic PSF guidance describes manual selection and the limitations of automatic detection.
Keep an untouched reference file. Record whether later files have been resized or otherwise processed, and avoid mixing measurements from different stages in the same comparison. Your aim is a record whose numbers have a clear meaning, not a competition for the smallest value.
If stars are visibly elongated, follow the repeatable star-shape diagnosis before treating sampling as the explanation. A width measurement does not identify its cause.
Decide what the evidence permits
Sampling calculators can help identify combinations worth examining. Their labels depend on assumptions: Astronomy Tools, for example, changes its suggested sampling range with the seeing selected by the user. An assumed input remains an assumption even when the output looks precise. Its published explanation is useful context for interpreting those labels.
Keep your present equipment while collecting evidence if your only concern is a calculator warning. Investigate the imaging process first if your measurements are inconsistent or star shapes raise a separate question. Consider a different camera or focal length when you can explain what sampling change you want, how it fits your target, and which observation would demonstrate a useful improvement.
A good decision note can be short: “This is my calculated scale; these are my measured angular star widths; atmospheric seeing remains unmeasured; this is the comparison I need next.” That is a stronger basis for spending money than treating arcseconds per pixel as a verdict on the sky.
Continue planning
Related guides
Power
Build an astrophotography power budget that survives the night
Optical train
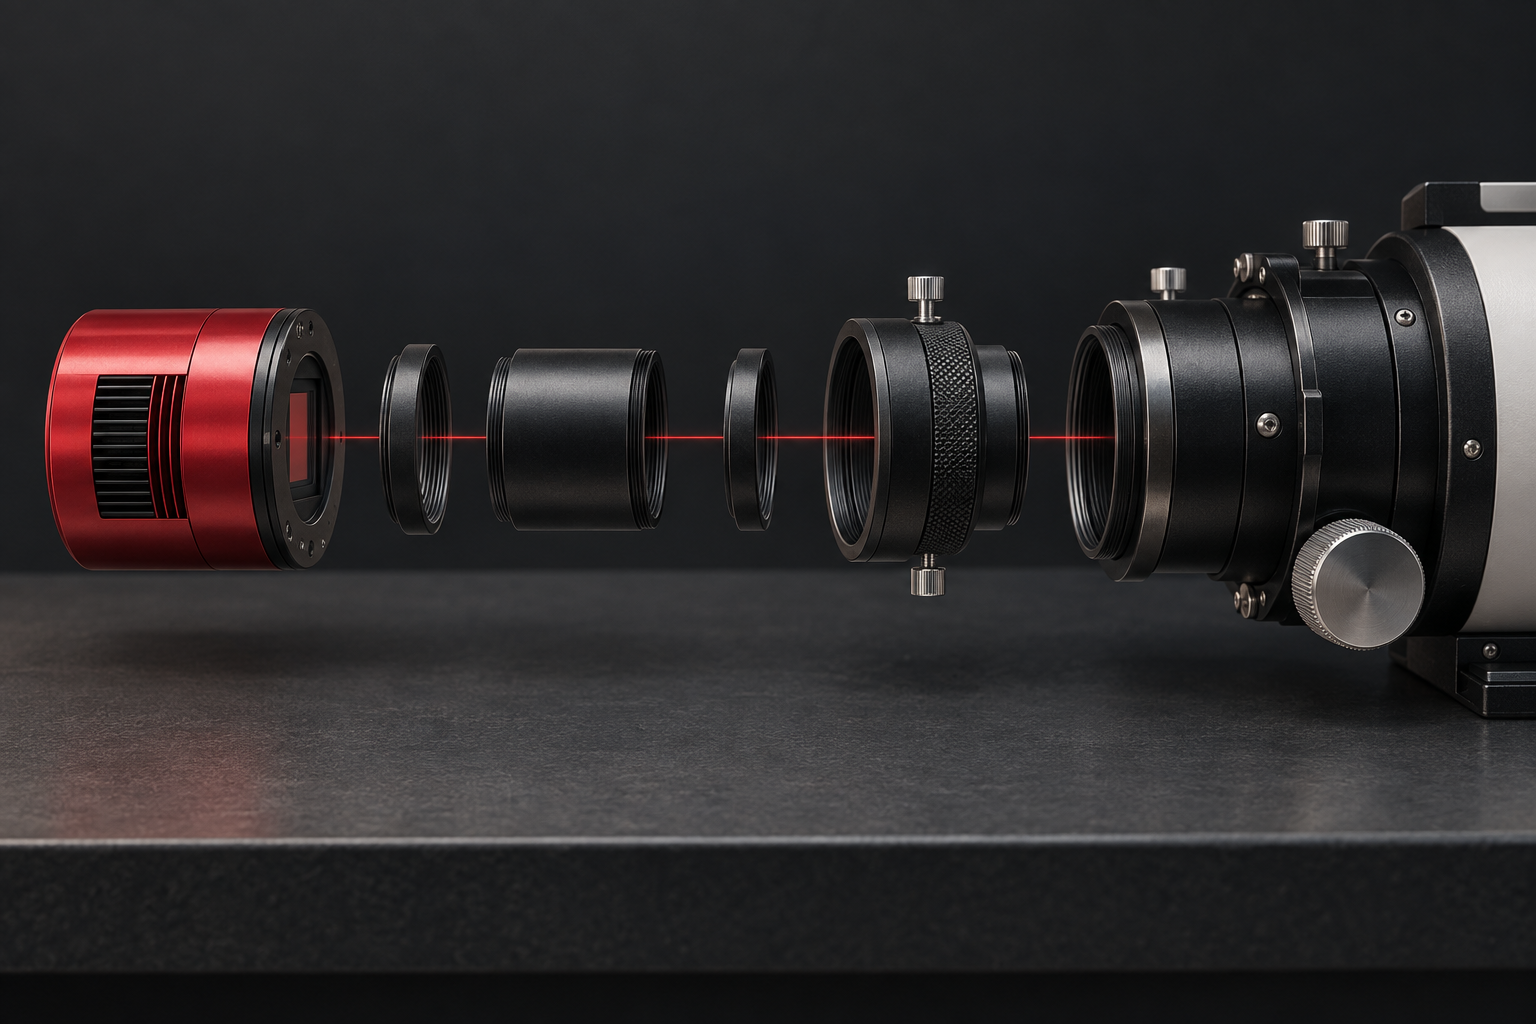
Backfocus and spacing without guesswork
Smart telescope comparison